agent.run() call writes a trace (the structured log of decisions, actions, and observations recorded during a run) to ./runs/<run_id>/ by default. The qita CLI tool reads these traces and exposes them through a local web board with run inspection, step-by-step replay, and standalone HTML export.
Trace artifacts (persistent output files from a run)
Each run directory contains three files:| File | Contents |
|---|---|
manifest.json | Run metadata: run_id, model_id, status, stop_reason, step_count, event_count, schema_version, prompt_hash, run_config_hash, seed, summary |
events.jsonl | One JSON object per line; each line is a RuntimeEvent with step_id, phase, ts, ok, error, and payload |
steps.jsonl | One JSON object per line; each line is a StepRecord with step_id, decision (the model’s structured output), actions (the tool calls dispatched), action_results, observation (the environment’s response), and critic_outputs |
manifest.json is written on initialization and finalized when the Engine exits. events.jsonl and steps.jsonl are append-only and grow one entry at a time during the run.
qita board
qita board starts a local HTTP server that discovers all run directories under a log root and renders a card grid.
Start the board
http://127.0.0.1:8765 by default. Open it in a browser.Available flags:| Flag | Default | Description |
|---|---|---|
--logdir | ./runs | Root directory containing run subdirectories |
--host | 127.0.0.1 | Bind address |
--port | 8765 | Bind port |
Browse runs
The board auto-refreshes every 2.5 seconds. Each run appears as a card showing: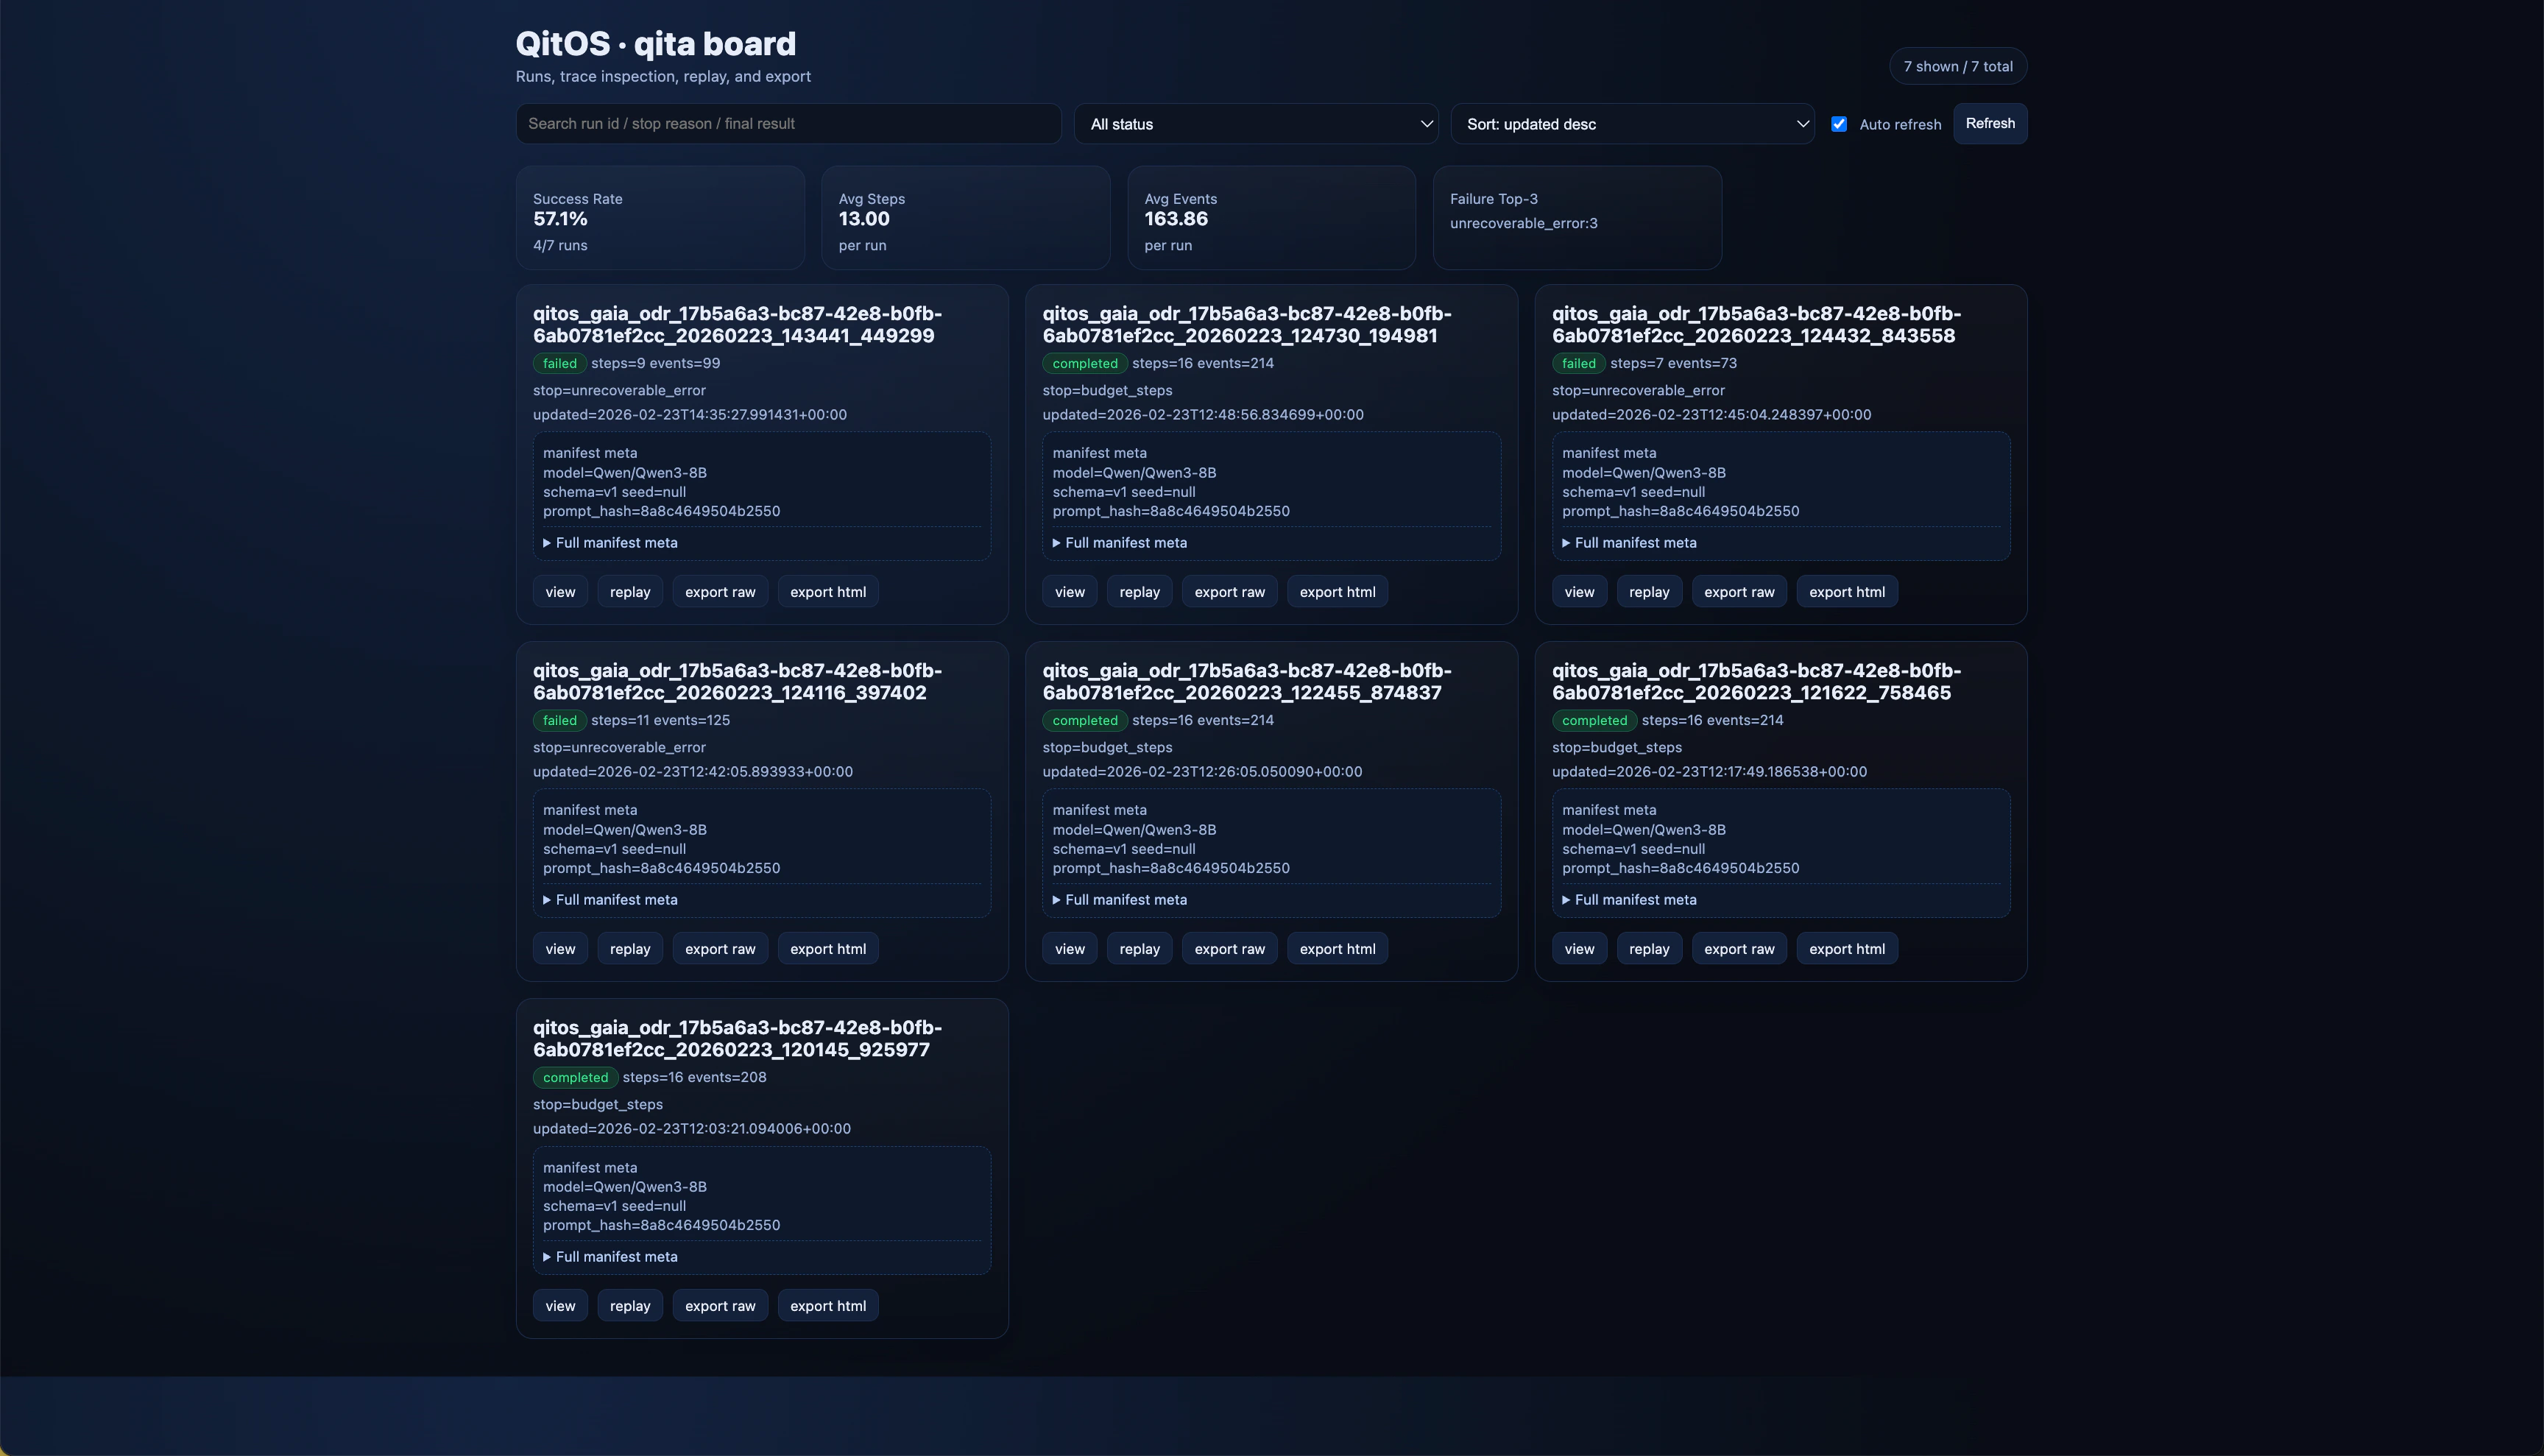
- Run ID
- Status badge
- Step count and event count
- Stop reason
- Last updated timestamp
- Manifest metadata: model ID, schema version, seed, prompt hash
- Search — filters run ID, stop reason, and final result text
- Status filter — show only runs with a given status (
completed,failed, etc.) - Sort — by updated time (desc/asc), event count, or step count
- Auto refresh — toggle the 2.5-second polling on or off
Open a run
Click view on any run card to open the run detail page. The page has two tabs:Traj tabThe trajectory (the ordered sequence of steps the agent took) view shows every step as a card with five collapsible sections: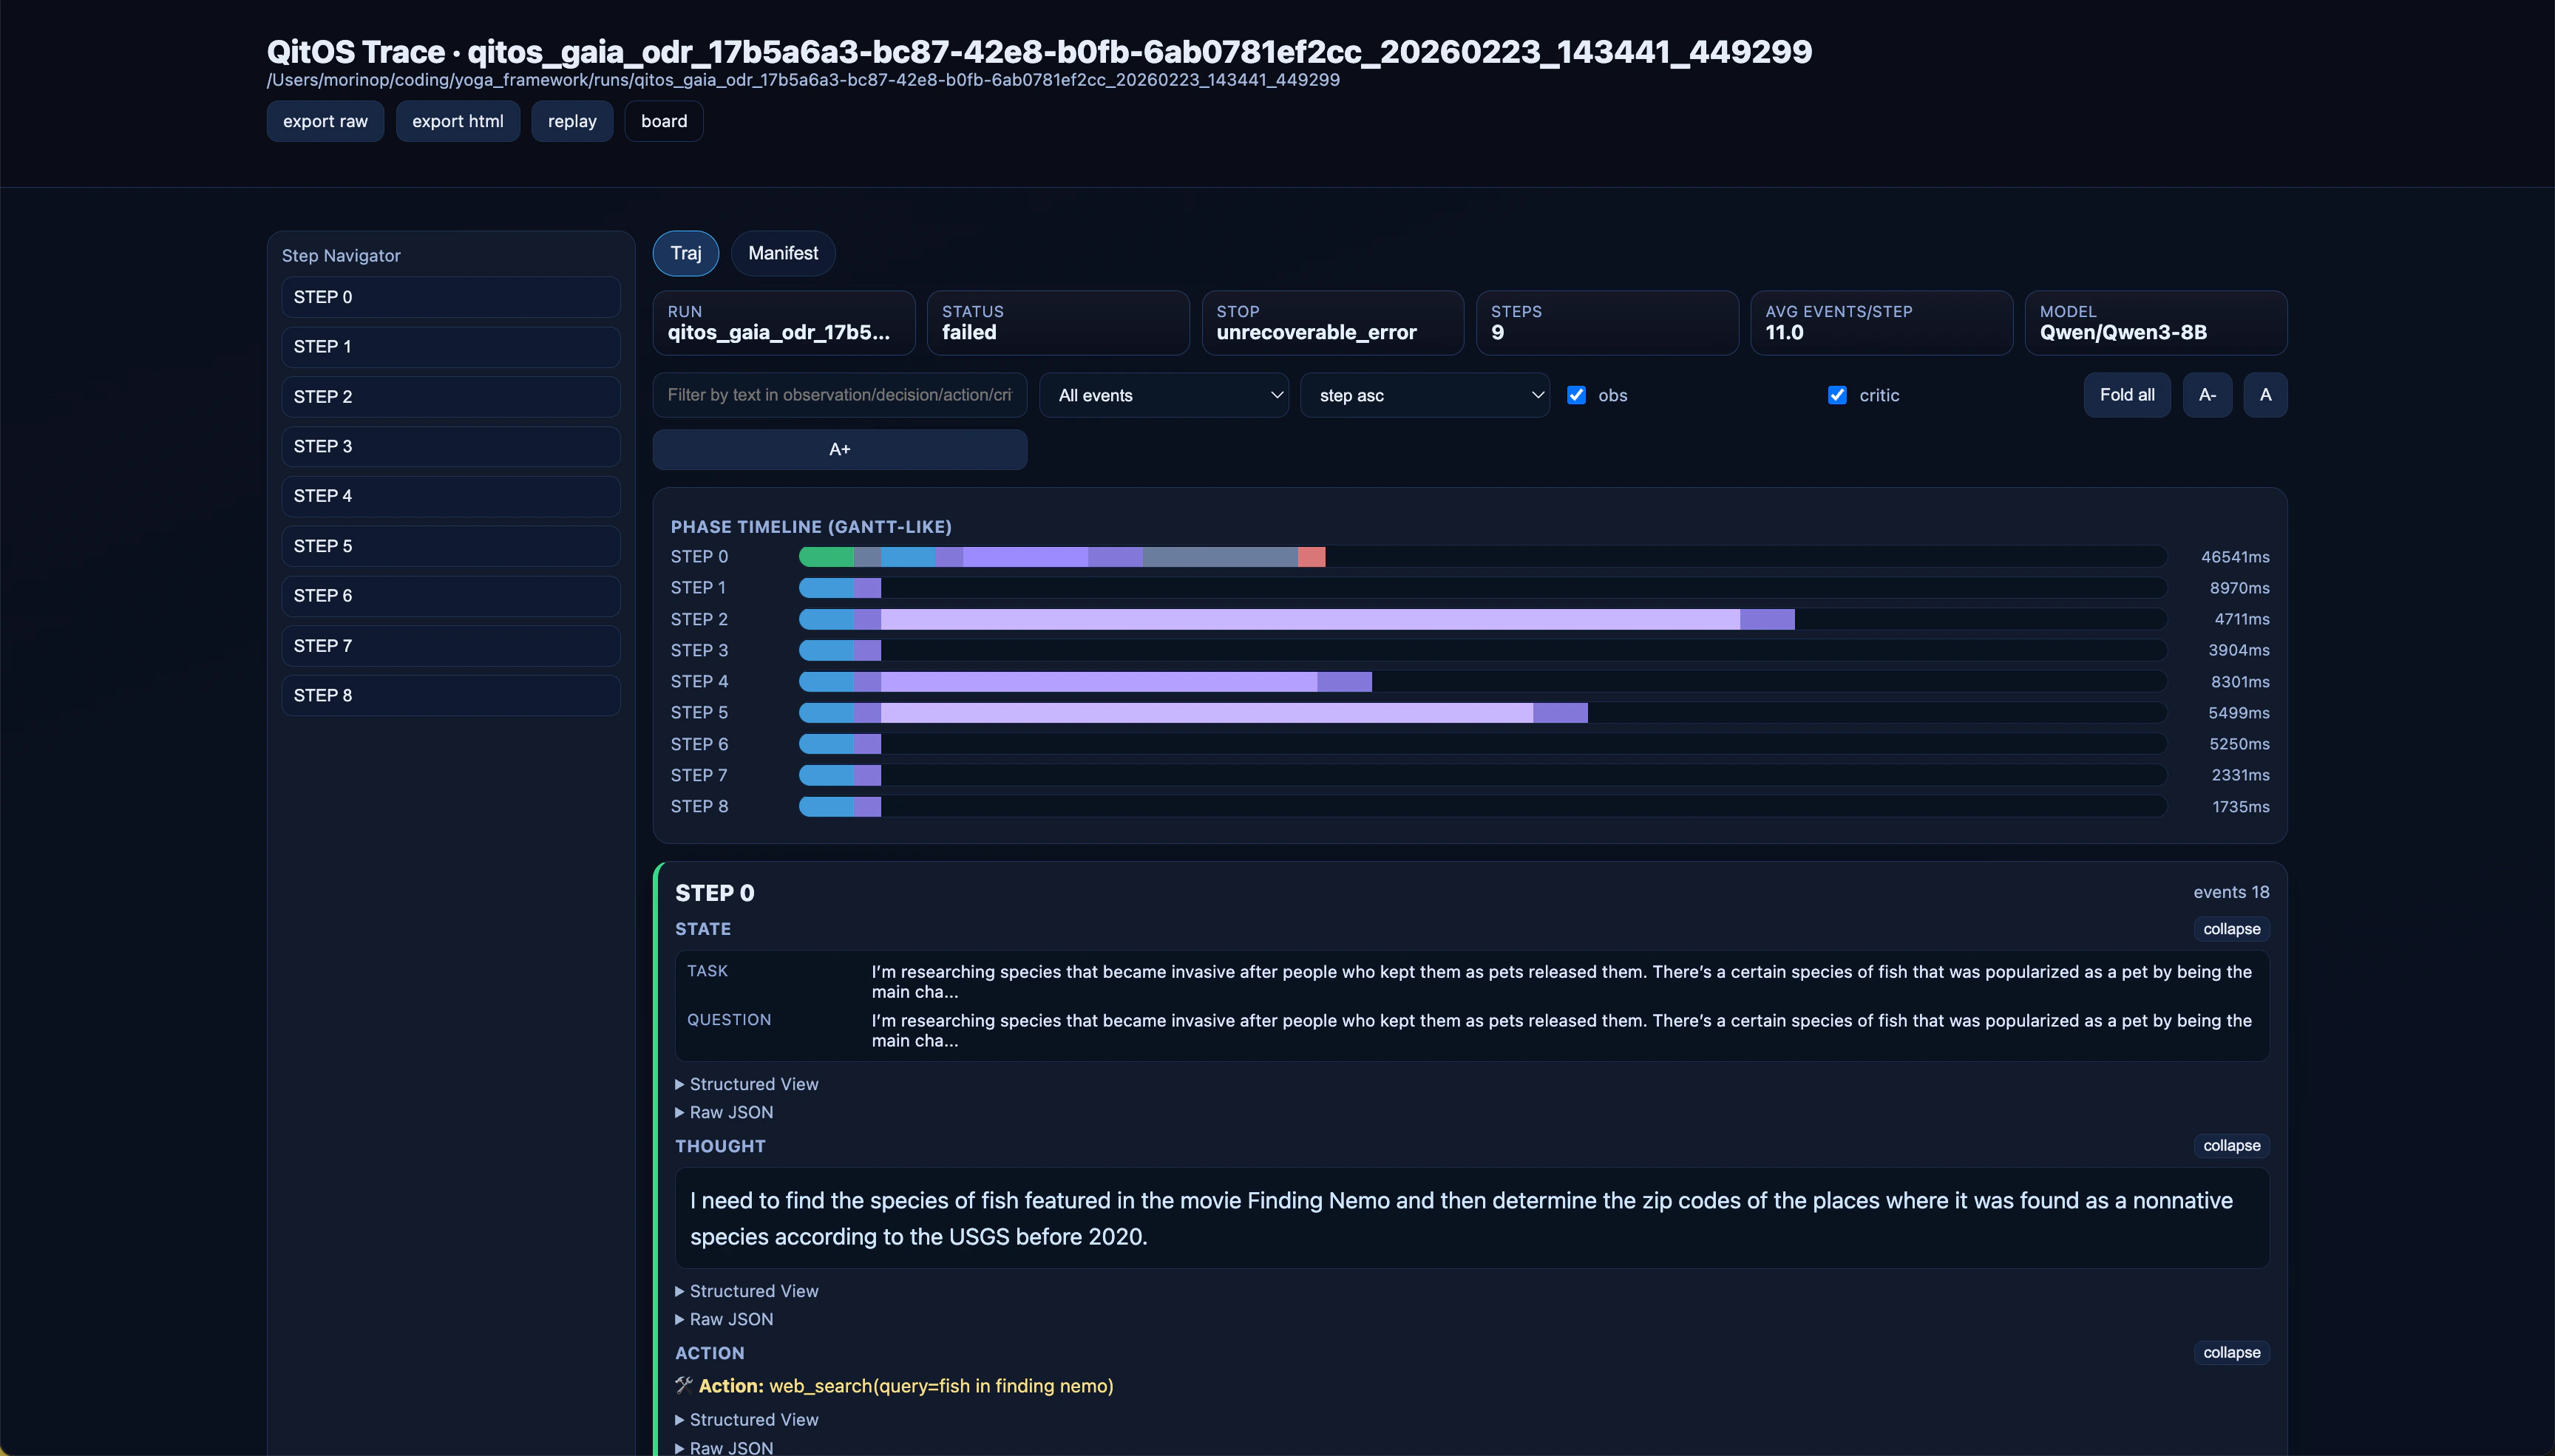
- State — scalar fields from the observation output
- Thought — the model’s rationale (from
decision.rationaleor parsedThought:line) - Action — the tool call that was dispatched based on the decision
- Direct Observation — action results (the data returned after the tool executes); search hits render as a table, errors are highlighted
- Critic — critic (a step-level validator) output (
action,reason,score) if critics were attached - Trace Events — raw
RuntimeEventlist for the step (collapsed by default)
- Filter by text across all step content
- Filter by event phase
- Sort steps ascending or descending
- Toggle observation and critic sections
- Fold or expand all sections at once
- Adjust font size with
A-/A/A+
manifest.json as formatted JSON.The trajectory view is where parser (raw-output-to-Decision converter) behavior, tool calls, and step timing become easy to inspect:qita replay
qita replay opens a single run in playback mode, stepping through events in time order.
| Flag | Default | Description |
|---|---|---|
--run | required | Path to the run directory |
--host | 127.0.0.1 | Bind address |
--port | 8765 | Bind port |
?speed=300 in the URL to set the millisecond interval between frames (minimum 100 ms).
qita export
qita export produces a single standalone HTML file that embeds all run data. Share it without running a server.
| Flag | Description |
|---|---|
--run | Path to the run directory (required) |
--html | Output HTML file path (required) |
Configuring trace output
By default,agent.run() writes traces to ./runs/ under a run ID constructed from the agent class name and a UTC timestamp. Override the output directory and prefix:
trace=False:
TraceWriter (for example, to share a run ID across multiple agents), construct it explicitly:
Three files are required per run for
qita to discover it: manifest.json, events.jsonl, and steps.jsonl. A run directory missing manifest.json is silently skipped by qita board.Real-time streaming with SSE
qita provides a Server-Sent Events (SSE) endpoint for each run that streams step events in real time. This is useful for building custom dashboards or integrating with external monitoring.SSE endpoint
| Event type | When emitted |
|---|---|
run_start | Run begins (includes run_id, task, agent_name) |
step_start | A step begins (includes step_id, agent_id) |
step_end | A step completes |
phase | A runtime phase event (decide, act, reduce, etc.) |
handoff | An agent handoff event |
delegate | A delegate event (1:1 sub-task) |
fanout | A fanout event (1:N parallel sub-tasks) |
run_end | Run finishes (includes step_count, stop_reason) |
Client-side consumption
From any web page:Live stream button
The qita run detail page includes a live stream button that connects to the SSE endpoint and logs events to the browser console. This is useful for debugging and understanding the event flow of a completed run.Streaming with AsyncEngine
For live runs, useAsyncEngine.arun_stream() to consume events programmatically: